
Interview with Joseph Hickey
From the Bank of Canada to the inconvenient datasets nobody wanted to check


Joseph Hickey spent years as a data scientist at the Bank of Canada before leaving to pursue independent research at CORRELATION Research in the Public Interest, a small Canadian organization that takes on questions most academic institutions avoid. Trained as a physicist with a PhD and a background in complex systems, he applies the same analytical tools—statistical analysis, network science, epidemiological modeling—to domains where the official numbers and the raw data tell different stories. His published work spans peer-reviewed papers in PLOS ONE and Cureus on epidemic modeling, a recent quantitative evaluation of the Nobel Prize-winning COVID-19 vaccine’s mortality claims, and a December 2025 report arguing that essentially all of Canada’s reported warming since 1948 traces to a single ~1°C stepwise artifact in the homogenized temperature record around 1998.
The throughline in Hickey’s research is a refusal to treat processed data as settled fact. At the Bank of Canada in June 2021, he emailed Environment Canada scientists directly about the 1998 discontinuity he had found in the AHCCD temperature series—the same finding that would later become his public report. His COVID work with Denis Rancourt and Christian Linard uses high-resolution geotemporal all-cause mortality data to show that the Spring 2020 death spikes in New York City and Lombardy are incompatible with person-to-person spread of a novel virus, pointing instead toward stress and medical mistreatment in hospitals and care homes. His 2023 modeling work demonstrates how segregating vulnerable populations into care facilities can raise their infection and death rates rather than lower them. Alongside the technical research, he has written to Parliament opposing the Emergencies Act, filed a 766-page appeal after losing his job over vaccination status, and tracked arbitration rulings reinstating Canadian workers fired under mandates.
This interview starts from the basics. Hickey’s findings challenge widely held conclusions in climate science, pandemic epidemiology, and vaccine policy, and the underlying analyses involve temperature homogenization procedures, mortality geostatistics, and compartmental epidemic models that most readers have never encountered. The questions that follow ask him to explain what he looked at, what he found, and why it matters—in terms that assume no prior familiarity with the technical literature. The aim is to let a careful researcher walk through his own evidence and let readers judge the arguments on their merits.
With thanks to Joseph Hickey.

Support This Work
This work remains free because paid subscribers make it possible. If you find value here, consider joining them.
Paid subscribers get access to all books — including The DMSO Book, The Kitchen Remedies Guide, Chlorine Dioxide, The PSA Trap, Breast Cancer, and more — with 1-2 new books added each month. Plus the Deep Dive Audio Library: 180+ in-depth audio book summaries and discussions.
Pricing Update: The annual subscription moves from $50 AUD to $50 USD on May 1 — the first change in five years. Current paid subscribers keep their existing rate. Free subscribers can lock in the current price by upgrading before May 1.
1. Joseph, you have a PhD in physics and worked as a data scientist at the Bank of Canada. That’s a pretty conventional career path for someone with your background. How did you end up running an independent research organization that challenges official government data on climate and pandemic mortality?
Actually, my academic background is a bit unconventional, in that I kept trying to make societally relevant contributions as part of my graduate studies in science (MSc and PhD) and continuously butted heads with institutions along the way.
I graduated summa cum laude with an Honours Bachelor of Science degree in Physics from the University of Ottawa in 2008, and received an Alexander Graham Bell Canada Graduate Scholarship from the Natural Science and Engineering Research Council of Canada (NSERC) to pursue a Master’s degree.
I applied to enter the Master’s program in Physics at the University of Ottawa with Professor Denis G. Rancourt. At the time, we had discussed a potential Master’s project using a simple first-principles approach to investigate the validity of the anthropogenic global warming paradigm. However, at the same time, in autumn of 2008, the university was in the process of constructing an artificial case against Professor Rancourt in order to wrongfully fire him. The incoming President of the university, Allan Rock, a former Minister of Justice and Attorney General under long-time Prime Minister of Canada Jean Chrétien, was behind that firing.
I and the other students involved in opposing the univerity’s firing of a tenured professor on a constructed charge that he gave too many A+ grades in his classes received a crash course on institutional misbehaviour in direct opposition to its purported mission in society.
I ended up doing my Master’s at the University of Ottawa under the supervision of Professor Ivan L’Heureux, following Rancourt’s unjust firing. As a Master’s student, I was twice elected to be the representative to the university Senate for graduate students in the Faculties of Science, Engineering, Medicine, and Health Sciences. The Senate is the highest committee on academic matters at the university, with members representing the university executive, deans, professors, students, and staff members. The Senate is responsible, among other things, for creating and abolishing academic programs. Allan Rock, as President of the university, chaired the monthly meetings of the Senate.
I quickly learned that the University of Ottawa Senate was not a democratic assembly, but rather a roboticized rubber-stamping body for the administration’s plans to restructure and degrade the institution, in the service of “globalization” (Allan Rock’s own words).
As a Senator, I managed to make a number of motions and interventions opposing deleterious actions of the Rock administration such as:
a new exchange program with an Israeli university that had not been approved by Senate and which had been financially sponsored by powerful Canadian Zionist-lobby figures (Gerald Schwartz and Heather Reisman) without any signed contract and with no assurance of fair access to the program for Palestinian students, despite the partner university (University of Haifa) having been proven in Israeli court to have discriminated against Arab students a few years earlier;
the university’s funding of a professor’s lawyer’s fees in her private defamation lawsuit against Professor Rancourt in the amount of $1.65 million (plus $333,000 the university spent on its own lawyers in the same case), as revealed by Access to Information documents I obtained following a lengthy legal battle against the university which I won many years later;
vicious racist treatment of international students including expelling them from the university when they spoke out about it;
and much more.
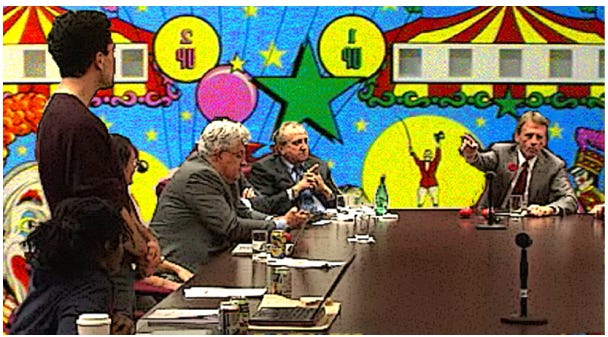
My criticisms irked the administration enough that President Rock eventually exploded (video here) while chairing one Senate meeting in November 2011, after I had pointed out his repeated absences from Senate meetings despite his statutory legal responsibility to chair those meetings under Ontario law.
After I noted that I had obtained Access to Information documents proving Rock had organized a private reception at his residence at a time requiring him to miss part of a Senate meeting, he pointed his finger at me, exclaiming “is this why we have students on the Senate, Mr. Hickey? To poke through the President’s schedule to see when he arranges receptions for members of the Board and potential donors?”
He went on to explain how, when he was president of the University of Ottawa student union in the 1960s, the “whole centrepiece” of his student union presidency was “to push this university to put students on the Board and the Senate”, but that “when we insisted on student representation, it wasn’t so we could stand up in the Senate and ask the President to produce his guest list for a reception he held on behalf of the university”.
The red balls in front of Mr. Rock and his executives that can be seen in the video are stress balls that were distributed by the University Ombudsperson earlier in the meeting, following my request for an apology from a vice-dean (Prof. Denis Bachand) who had publicly called me “sick in the head” when I had protested the substitute chairman’s unilateral order to shut off the video recording at the previous Senate meeting in violation of a Senate policy after I questioned President Rock’s repeated unannounced and secret “globalization” absences.
It was a bit of a circus, as I depicted in the image below, using a still from the video recording of one of the Senate meetings:
Videos of the Senate meetings that I participated in are hosted on my YouTube channel.
Executives and deans on the Senate approached me several times on the sidelines of the meetings to ask how my Master’s thesis was progressing and when I would be finished!
After completing my Master’s in Physics in 2012, I co-founded the Ontario Civil Liberties Association (OCLA) and volunteered as its Executive Director for many years. We organized public events and campaigns on many issues including freedom of expression, police accountability, and institutional transparency.
There is a dedicated section on OCLA’s site listing our work opposing the many deleterious COVID-era public health measures, beginning in April 2020.
There is another dedicated section on OCLA’s site about my own legal battle against the government regarding its coercion tactic of denying employment insurance (EI) to those who were fired from their jobs for refusing the government’s COVID-19 vaccination mandate in 2021-2022.
I received a second Alexander Graham Bell Canada Graduate Scholarship from NSERC in 2014, this time to pursue a PhD. The NSERC evaluation committee ranked me first out of more than one hundred applicants in my category. I found a supervisor (Dr. Kuiying Chen) at the University of Ottawa, and applied to the PhD program there, to do a project using statistical physics methods to model how judges make decisions in court cases. After submitting my application, the Chair of the Department of Physics, Professor Thomas Brabec wrote me an email acknowledging my application and wishing me best of luck with my PhD. However, the official response from the university was to deny my application and bar me from the PhD program on the basis that my proposed project did not qualify as “physics”. I appealed that decision to the Executive Committee of the Faculty of Graduate and Postdoctoral Studies, to no avail.
I ended up doing my PhD in the Complexity Science Group at the University of Calgary’s Department of Physics and Astronomy. I encountered some resistance to my project studying social hierarchies, with one member of my candidacy exam committee voting against allowing me to continue with my project in order to “send me a message” not to explore further socio-political aspects of my research. My first article from my PhD is entitled “Self-organization and time-stability of social hierarchies”. It was initially rejected by a biased editor at the journal PLOS One, and it was eventually published in that journal following my successful appeal of the editor’s decision.
The second paper from my PhD in Physics was about the legal system and court cases, the same subject area that had caused me to be rejected by the University of Ottawa. That paper is entitled: “The Influence of Landmark Judgments and Statutory Changes on the Family Litigation Explosion: A Citation Network Analysis”.
I was hired at the Bank of Canada coming out of my PhD, to work on agent-based models of economic activity. My work on that topic resulted in a paper published in 2024 in the journal Physica A: Statistical Mechanics and its Applications. At the Bank, I was also tasked with modeling economic impacts of COVID measures and studying correlations between climate factors and economic activity in Canada, which led me to notice an interesting feature in Canada’s land-surface air temperature data, which we discuss in the questions below.
2. While at the Bank of Canada, you were working with Environment Canada’s temperature data and noticed something odd. Can you walk us through what you saw when you first plotted those temperature graphs?
In 2021, while working at the Bank of Canada, I was asked to study temperature data for Canada using Environment and Climate Change Canada (ECCC)’s 3rd Generation Adjusted and Homogenized Canadian Climate Data (AHCCD) dataset.
The AHCCD temperature data consist of daily maximum, minimum, and mean (average of max and min) temperatures for individual weather stations in Canada.
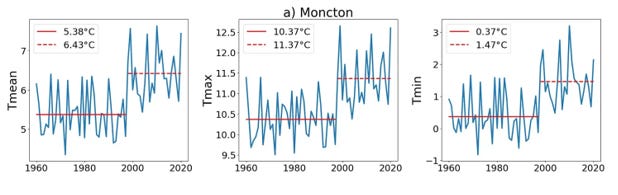
I made graphs of the annual average temperature (i.e. the annual average of daily max, min, or mean temperatures) for individual stations. I noticed that, in many cases, the annual average temperature was hovering around a low plateau level for several decades prior to the late 1990s, then jumped up in one year (1998) to a higher plateau level, which was maintained until the end of the data series (2020).
This feature can be called a “stepwise increase” in annual average temperature, because it consists of a sudden jump (occurring at 1998) from a low plateau value (spanning many years prior to 1998) to a high plateau value (spanning many years from 1998 on). The size of the jump or “step” is approximately 1℃ in magnitude, for many stations.
An example for Moncton, New Brunswick is shown below:
More graphs and explanations of the 1998 step-increase feature can be found in my December 2025 report for CORRELATION Research in the Public Interest, here: https://correlation-canada.org/artificial-stepwise-increases-in-temperature-data-canada/.
3. You raised these concerns directly with Environment Canada researchers. What happened when you showed them what you’d found?
This stepwise increase of approximately 1℃ in magnitude (the “1998 step-increase feature”) in many Canadian surface air temperature records was concerning to me, because researchers, including researchers at ECCC and in my own department at the Bank of Canada, had adopted the practice of fitting a linear trend to such data and then claiming an approximately 1-2℃ warming “trend” over the past six or seven decades.
However, it is not mathematically appropriate or meaningful to fit a linear trend to data with a stepwise increase from a low plateau to a high plateau.
Rather than a gradually increasing “trend”, the data suggested that essentially all of the “warming” for the stations exhibiting the 1998 step-increase feature occurred in the single year 1998.
This single-year stepwise increase is incompatible with the paradigm that gradual addition of CO2 to the atmosphere has caused and is causing air temperature to increase. The anthropogenic CO2 paradigm predicts a gradual increase in temperature over many years, not a sharp discontinuity where all the warming occurs in a single year.
I showed graphs of annual average temperature exhibiting the 1998 step-increase feature for several Canadian stations at across Eastern and Central Canada to the ECCC researchers responsible for creating ECCC’s temperature dataset. I asked the researchers to explain whether the 1998 step-increase feature could be due to a measurement artifact, which might have arisen, for example from changing from manual to automatic measurment in the 1990s. ECCC’s senior researcher Lucie A. Vincent responded to me that the 1998 step-increase feature was “probably due to natural variability”, but did not explain how it could have occurred naturally.
4. For readers who aren’t statisticians—why is a sudden jump in temperature records in a single year a red flag? Why couldn’t that just be an unusually warm year?
1998 was in fact an unusually warm year in north-eastern North America, but it is what happened in the years that followed that matters most. For the years following 1998 (up to the present), the annual average temperature for many Canadian stations hovers around a plateau. This post-1998 plateau is higher than the plateau in annual average temperatures that exists for the same stations in the decades leading up to 1998.
We are continuing to research the origin and cause of the 1998 step-increase feature, and have now confirmed that it exists for most of the Eastern part of North America, as I showed in my recent (February 2026) presentation on Tom Nelson’s podcast. In that presentation, I also explained that we are looking further into how the 1998 step-increase feature is correlated with and may have been caused by the beginning of the warm phase of the Atlantic Multidecadal Oscillation (AMO). Such a geoplanetary cause for a step-wise increase in continental-scale surface mean temperatures is not presently explained by global circulation models with ocean-atmosphere coupling and may be fundamentally caused by geo-tectonic dynamics.
5. A colleague at the Bank of Canada found over 10,000 days in the temperature records where the daily minimum was higher than the daily maximum—which is physically impossible. How does that happen in official government data?
ECCC applies “homogenization” adjustments to its temperature data. For example, this can be done when ECCC observes that the temperature record has a sudden break, which can be due to moving a weather station to a new location, changing the station’s thermometer or other instruments, or changing the observation procedures at the station for measuring daily temperatures.
As shown from Access to Information emails in my December 2025 report, Bank of Canada Economist Julien McDonald-Guimond pointed out to ECCC researchers that he had found 10,159 cases in which the minimum daily temperature for a station was greater than its maximum daily temperature, which is physically impossible.
ECCC responded that this absurd result had been created due to an adjustment that it made in which daily minimum temperatures were shifted upward to “correct” for what it had assessed was a “cold bias” in the data.
In other words, ECCC shifted up daily minimum temperatures so much that they became greater than the daily maximum temperatures in more than 10,000 cases.
According to ECCC, the “cold bias” is due to a change in the time of day at which daily minimum and daily maximum temperatures were recorded at primary weather stations in Canada. The change was implemented in 1961.
To be a bit more specific, before weather stations started becoming automated, daily minimum and maximum temperatures were recorded using extremum thermometers that capture the extreme temperature value (either the maximum or minimum, depending on the thermometer) that the thermometer has been exposed to since the last time it was reset. Typically, an employee would observe and record the maximum temperature once every 24 hours, at a time of day far from the usual late-afternoon diurnal maximum temperature and then reset the extremum thermometer used for capturing the maximum temperature for the next 24 hour period. Likewise, an employee would observe and record the minimum temperature once every 24 hours, at a time of day far from the usual early-morning diurnal minimum temperature, and then reset the extremum thermometer used for capturing the minimum temperature for the next 24 hour period.
Thus, prior to 1961, the maximum temperature was usually observed and recorded around 07:00 local time and minimum temperatures were observed and recorded at around 17:00 local time.
However, in 1961, the observation time for all stations, for both maximum and minimum temperature, was set at 06:00 coordinated universal time (UTC) which is near midnight in Eastern and Central Canada.
Observing the minimum temperature near midnight local time (06:00 UTC) can result in recording a minimum temperature corresponding to the same diurnal temperature-trough for each of the two adjacent calendar days surrounding midnight, whereas this does not happen when the daily minimum temperature is observed at around 17:00 local time. For this reason, ECCC assesses a “cold bias” in the daily minimum temperature data for many days and for many stations post-1961.
To adjust for the said “cold bias” in the data, ECCC has adopted a procedure to shift daily minimum temperatures upwards. We are looking into evaluating the validity of ECCC’s procedure, in our research.
The Access to Information emails included in my December 2025 report also show that ECCC “resolved” (their word) McDonald-Guimond’s questions about the 10,159 days with daily minimum temperature greater than daily maximum temperature by further adjusting the data to arrive at a result in which all daily maximum temperatures were higher than all daily minimum temperatures. ECCC did not explain how this additional adjustment was made.
6. You’ve also done extensive research on COVID-19 mortality. One of your studies looked at the claim that vaccines saved 14 million lives in their first year. How did you go about testing whether that claim holds up?
The claims of “millions of lives saved” by the COVID-19 vaccines are based on so-called “counterfactual modeling”.
Scientists run epidemic models attempting to calculate the number of deaths that would have occurred in a population if no COVID-19 vaccines had been administered. Then they take the number of deaths that would have occurred (according to the model) in a world without vaccination, and subtract from that the number of deaths that actually occurred (in the real world) and claim that the difference in those two numbers is equal to the number of lives saved (or deaths averted) by the vaccines.
The problem with these counterfactual modeling exercises is that the researchers virtually never show what the mortality patterns look like in their imaginary modeled worlds without vaccines. If they did, it would be immediately apparent that the peaks of deaths that allegedly would have occurred without vaccines (according to the counterfactual models) are too enormous and their timing too coincident with vaccination to be plausible or realistic. The models produce fantastical results that are disconnected with reality.
To show this, we reverse engineered the model results and showed what the weekly all-cause mortality curves would look like if we believed the modelers’ counterfactual imaginary world without vaccines.
From our reconstructed graphs of weekly mortality in the modelers’ no-vaccination scenario, one can see that mortality in 2021 would have had to have been much larger than mortality in 2020, including for jurisdictions where there was essentially no excess mortality in 2020. Moreover, the unprecedentedly enormous peaks of excess mortality would have occurred (in the modelers’ no-vaccination scenario) at precisely the time that the vaccines were rolled out, and not before or after. And, if we believe the modelers, the vaccines would have brought actual excess mortality for 2021 and 2022 right down to the same value of excess mortality for 2020 (before vaccines), rather than some intermediate value, as one would expect.
In brief, the incongruence between mortality in the modelers’ version of a world without vaccines (on the one hand) and actual observed mortality (on the other hand) is so striking that it is palpably absurd.
We have explained these points in detail in two papers: our October 2023 paper shows that the claims of tens of millions of lives saved globally is implausibe; and our October 2025 paper — in which we refined our method for reconstructing the weekly mortality curves corresponding to the modelers’ no-vaccination scenario — shows that the claims of approximately 3 million lives saved in the USA is also implausible.
7. Your more recent work argues that the deaths in Spring 2020—places like New York City and northern Italy—couldn’t have been caused by a spreading virus. That’s a striking claim. What in the data led you there?
In our June 2025 paper “Constraints from geotemporal evolution of all-cause mortality on the hypothesis of disease spread during Covid”, we used high-resolution (geographic and temporal) all-cause mortality data to compare all-cause mortality patterns over time for different regions.
Focusing on the first few months of the declared pandemic (March-May 2020), we proved that all-cause mortality patterns are incompatible with the paradigm of a spreading novel pathogen. Such a proof in science means that the hypothesis (paradigm) of a spreading new and fatal viral pathogen, as a main cause of excess mortality during the so-called first wave of the declared pandemic, must be abandoned.
The state of the art large-scale spatial epidemic models predicted that a novel viral respiratory pathogen originating in China would cause epidemic peaks of infections in all the cities with large airports in Europe and the USA within the first few weeks of spread. However, in reality, the all-cause mortality data shows stark differences in outcomes for cities with similar demographic and health care system characteristics and which received similar numbers of air traffic passengers from China and East Asia.
One key example is to compare Milan in northern Italy, which had enormous excess mortality during March-May 2020, with Rome in central Italy, which had comparably very small excess mortality at the same time, despite the similarities of the two cities including similar population age structures, similar health care systems and similarly large airports receiving travellers from China and East Asia (in fact, Rome had significantly more travellers to and from China and East Asia in 2019 than Milan). We made a similar comparison between New York City (very high March-May 2020 excess mortality) vs Los Angeles and San Francisco (low or non-existent March-May 2020 excess mortality) in the USA.
We also showed that there are stark differences in excess mortality for neighbouring jurisdictions in many regions across Europe and the USA during March-May 2020, despite the fact that there continued to be a significant amount of cross-border traffic at that time.
We also showed that, for regions for which there was a large peak of excess mortality during March-May 2020, when you look inside those regions at smaller geographic scales, excess mortality peaks rose and fell in lockstep synchrony across the region. In other words, there is no evidence of spatio-temporal spread within provinces or states with large excess mortality. In contrast, leading large-scale spatial epidemic models predict a lag of several weeks in infection curves when comparing urban centres (where the infectious pathogen is presumed to most frequently first arrive due to long-distance travel between urban hubs) and outlying rural areas. Instead of the said predicted lag, the all-cause mortality data shows that peaks of excess mortality in rural areas are synchronous with the urban centres in the same provinces or states.
8. If it wasn’t a virus spreading person to person, what do you think was actually killing people in those early months?
Given the incompatibility of the spatially and temporally resolved all-cause mortality data with the paradigm of a spreading novel pathogen, we have proposed an alternative hypothesis to explain all-cause mortality patterns in Europe and the USA during March-May 2020.
The government’s aggressive public health measures imposed a high degree of biological stress on the population, causing vulnerable individuals to be more susceptible to respiratory conditions such as bacterial pneumonia, which do not require a spreading paradigm. This was combined with medical mistreatment (including intense overuse of mechanical ventilators, which are inherently dangerous) during March-May 2020 in locations with very high excess mortality, such as New York City and Milan.
Public health measures, including lockdowns and “shelter-in-place” policies, were severe during the first-peak period (March-May 2020) in excess mortality hotspots. Such measures ― applied in a context of fear and panic stimulated by mass media and government pronouncements ― subject many individuals to a high level of biological stress. In this state of elevated stress, which results in immune response suppression, many individuals may have developed self-infection pneumonia, either via introduction of microbes into the respiratory system due to aspiration or via changes to the respiratory system microbiome itself without aspiration.
Our county-level results also show that very poor urban neighbourhoods that border on very rich urban neighbourhoods (such as the Bronx in New York City, which is adjacent to Manhattan) were the deadliest places during March-May 2020. We suggest this may be linked to the presence of large “safety net” hospitals in the poor neighbourhoods, partly funded by philanthropy or taxation of the wealthy residents living nearby.
These points are presented in more detail in our paper.
9. You lost your job at the Bank of Canada because you didn’t comply with the vaccine mandate. Can you tell us what that experience was like and how it shaped what you’ve done since?
In the autumn of 2021, the Government of Canada directed public sector employers to implement vaccine mandates requiring their employees to get injected with COVID-19 vaccines.
My employer at the time, the Bank of Canada, was “eager” to implement the policy, as shown by Access to Information emails sent by the Bank’s HR director Alexis Corbett to staff at the Treasury Board of Canada responsible for guiding Crown corporations to implement their vaccine mandate policies.
At an online meeting with my colleagues on September 24, 2021, to announce the upcoming mandate, the Managing Director of my department, Marc-Andre Gosselin, was asked what would happen to employees who refused to be vaccinated. He responded that they would be put on leave without pay and that “after a few months without pay they will realize they need to get vaccinated”.
I asked for an exemption to my employer’s policy on medical, religious and human rights grounds. My employer denied my exemption request in November 2021, suspended me without pay for not being vaccinated, and stated my employment could be terminated if I did not get vaccinated.
In March 2022, while still under suspension without pay for not being vaccinated, I submitted a detailed internal appeal to my employer of its decision to deny me an accommodation (media article here). My internal appeal contained extensive scientific evidence, including more than 1000 peer-reviewed scientific articles, demonstrating the known health risks from the COVID-19 vaccines, which included potentially fatal heart inflammation (myocarditis and pericarditis), especially for males under age 40 (I was 36 at the time).
The government’s vaccination mandate was an unconstitutional act of coercion to strong-arm individuals into receiving an unwated and dangerous medical injection. Part of that coercion was the plan to deny Employment Insurance (EI) benefits to employees who were fired or suspended for refusing vaccination. Denial of EI, which employees are required to pay into while employed, added insult to injury for many people who lost their work for refusing vaccination.
Since 2021, I have been fighting my own legal battle to obtain EI after losing my work for refusing vaccination. All levels of decision maker —the Canada Employment Insurance Commission, the Social Security Tribunal of Canada (both General and Appeal divisions), and the Federal Court of Canada — have cast my refusal to be vaccinated as workplace “misconduct” disqualifying me from EI. Many other similar cases have gone to court recently. I appealed my case to the Federal Court of Appeal on April 3, 2026.
After the government dropped the vaccine mandates in June 2022, my employer refused to bring me back to work, and I ended my employment via a negotiated settlement in October 2022.
10. You filed a 766-page appeal and eventually won a settlement. What did that process teach you about how institutions respond when employees push back?
Generally, I have found that institutions are most concerned with how they are seen by the public, and so they are sensitive to bad press, which can come from being seen as having obviously mistreated people in some way. That sensitivity is one of the main levers in getting institutions to walk back or adjust bad policies and practices.
With a principled, courageous, and cool-headed approach, you can often make some headway in opposing deleterious institutional actions, although the institution always remains (much) more powerful than any individual.
The satisfaction of standing up for what is right, the freedom to speak openly and directly, and the feeling of vitality from doing meaningful work can at least partly compensate for the material losses that might be incurred when the institution strikes back, and might be more important to one’s individual health and well-being in the long run.
11. You wrote a letter to Canadian MPs on behalf of the Ontario Civil Liberties Association in February 2022, urging them to reject the Emergencies Act. The Federal Court of Appeal recently ruled the government’s use of that Act was unreasonable. How did it feel to see that ruling come down?
In my February 17, 2022 letter to Canadian MPs on behalf of the Ontario Civil Liberties Association (OCLA), I said there was no national emergency caused by the Freedom Convoy protesters in Ottawa.
Rather, the truckers were protesting government policy including mandatory medical procedures (vaccination mandates) that objectively violated the human rights of life, liberty, and security of the person, and of freedom of conscience and religion.
The government did use the Emergencies Act, applying extreme and unprecedented powers such as freezing the bank accounts of individuals deemed to be connected to the protest, and then riot police were sent in to crush the protest.
A mandatory Public Inquiry was held several months after the non-emergency of the Freedom Convoy protest was crushed by the government, and Commissioner Paul S. Rouleau (a former judge) found the government’s invocation of the Emergencies Act was justified.
Several civil liberties organizations sued the government, leading to the Federal Court and Federal Court of Appeal decisions declaring the government’s invocation of the Emergencies Act unreasonable and ultra vires (i.e., illegal), and that it violated the protesters’ constitutional rights.
Both the current Prime Minister of Canada, Mark Carney, and the current Chief Justice of Canada, Richard Wagner, made direct public statements during the Freedom Convoy protest that it amounted to anarchy or insurrection, which is contrary to reality. They, along with many others in powerful positions, participated in the lie constructed by the government and the media that an eminently peaceful protest in the nation’s capital was a threat to national security that could not be handled by any other existing law or democratic process, thereby justifying the most extreme use of power.
The Chief Justice, in particular, should recuse himself from all proceedings related to the government’s recently-submitted request to the Supreme Court of Canada for leave to appeal the Federal Court of Appeal’s decision, due to his demonstrated bias against the protesters.
Regardless of what the Supreme Court of Canada decides, the fact is that the government invoked the dictatorial powers of the Emergencies Act knowing full well there was no emergency, and they will do it again. The court decisions will not be binding because any future alleged “emergency” circumstances will be different from the circumstances in February 2022.
Meanwhile, the world is facing very real potential of the first use of nuclear weapons since 1945. The USA-empire is making a sequence of huge last-ditch gambles to retain supremacy. It is willing to destroy entire regions in the world and hopes to emerge the least battered among all its potential challengers in the growing multi-polar world.
Given the Canadian government’s use of emergency powers to brutally crush peaceful protest against obviously invasive public health measures during the COVID-19 era, one can imagine what will happen to protests against economic austerity and military tyranny (including conscription) in the coming era of USA-empire war and disruption.
12. Looking across your climate work and your pandemic work, do you see a common pattern in how official institutions handle data that contradicts their public positions?
Unfortunately, in the present period, institutions in Canada have proven that they work in direct opposition to their supposed societal missions. This can be seen in all spheres of institutional activity, from governance, to finance, to law, to academics, to medicine, etc.
13. CORRELATION Research in the Public Interest operates outside universities and government. What makes independent research possible, and what makes it difficult?
When citizens resist government campaigns to degrade society, they take actions, form groups for a while then disband, discuss and argue about what to do or not do. They act, and reflect, take material risks, experience losses, and hopefully win some victories along the way.
Independent research and analysis on topics of public interest fits into the arguing and discussing and reflecting phase. At its best, such research is an intellectual contribution that is directly useful in a societal struggle or battle, helping dispel smokescreens and lies constantly generated by the government and its propaganda agents. It can equip individual resisters with facts and arguments to help them stand their ground against the societal entities and people that participate in implementing measures and policies that degrade society in times of false crises and false external threats.
To the degree that individuals actively and vocally resist government and corporate degradation campaigns, there will be a more obvious need for independent research, and skilled people will contribute to that intellectual work. Without an authentic grassroots interest and need, there will be no independent research, only “research” that is in-effect propaganda funded by corporations and the governments that serve them. Corporate entities at the top of the establishment in Western societies are perpetually seeking to enhance their power, and are always seeking useful and directed sophistry (most establishment “research”) to accomplish this.
14. For someone reading this who’s never questioned official climate or health data before—what’s one thing you’d want them to take away from your work?
Start questioning it. The line of questioning will take you to places you might not have imagined. When governments rapidly align on a claimed invisible threat to humanity, it is time to start being skeptical and asking questions about whether it is really true, and whether there is any evidence one can see with one’s own eyes to support the claims of impending catastrophe that is not invented or created by those claiming it. Covid is certainly an example, as is the so-called climate crisis, but there are many more everywhere you look.
15. What are you working on now, and where can people find your research and follow what you’re doing?
We’re working hard on our independent research on mortality including during the COVID era and beyond; how, why, and whether the climate has been changing; and theories of societal structure and change. We describe this and more in our ongoing funding drive statement: https://www.givesendgo.com/correlation.
Check out our work at https://correlation-canada.org/ and sign up to our free newsletter on Substack at https://substack.com/@correlationresearch !