The Dutch COVID19 Truman Show
"We accept the reality of the world with which we're presented. It's as simple as that." The Truman Show
This was first written in early December 2020.
The Dutch are a very trusting people, it’s just one of many great things about their culture. They trust their Government, as over the years they have had no reason not to.
The Government has taken advantage of that trust, and has and is actively lying to them.
Eternal shame on them.
Why did I write this?
The only reason I put this together is because I am married to the loveliest yet most annoying, Dutch wife.
I have been reading about all things COVID since March 2020 and during that time we’ve had the occasional difference of opinion on what constitutes “truth”.
Anyway, in my readings/studies I’ve come across so many wonderful doctors, thinkers and writers that have shed light on what I call The Truman Show (this pandemic alternative reality bubble that has surrounded us all). They have shed light on the global, meta, issues for me and also, I’ve had plenty of insight into country level stories such as the US (and its individual states), UK, Ireland, Japan, Sweden etc.
But I haven’t come across anyone that has specifically written about Holland.
I have had no reason to believe that the Dutch narrative is any different to what is going on elsewhere.
Anyway, that’s not the reason I decided to look into Holland. The reason is that my wife, and other Dutch friends kept mentioning to me how Holland is air lifting patients to Germany and how COVID is overwhelming the Dutch hospital system. This is most often said with the clear inference that there is actually a genuine problem in Holland and that is why the government is stepping in with another round of country wide restrictions.
Something about all this didn’t make sense to me. But like most COVID stories, I am sure the headlines of airlifts to Germany are factually true. COVID19 headlines are almost always true in letter, but not true in spirit. But finding the spirit of these stories requires a bit of work so I put this outline together.
I did it mainly for me, so I could better understand the Dutch story. I am Dutch by marriage after all.
And secondly, I did it for my wife, so she wouldn’t have to.
Airlifting Headlines
Let’s start with the headlines that sowed the seed for this walk down data lane.
The airlift story it turns out was really only one story written for AP in late October (by a personal friend Mike Corder, of all people, and another guy) that got rehashed and retold far and wide.
Here are 3 headlines:
Dutch hospital airlifts patients to Germany amid virus surge[1] (AP: 23-10-20)
Dutch COVID Patients Airlifted to Germany Amid Surge in Infections[2] (23-10-20)
Holland transfers patients to Germany again as COVID infections spike[3] (Reuters: 23-10-20)
The story is true in letter.
The story has two clear inferences:
1. That the COVID19 problem, the “second wave” is of such a scale that the system cannot handle it
2. That government restrictions in Holland and around Europe are warranted to address this problem
But here are just some problems with the spirit of the story:
Only 2 patients were sent to Germany, with a few more (4) projected in the coming week. That is hardly a problem of scale
More patients were airlifted to Germany during the first wave
Holland has one of the lowest number of ICU beds per capita in Europe and Germany has the highest
The authors have done the research on German ICU capacity but are silent on the Dutch numbers. That’s a lie of omission, and a deliberate reframing of the problem
Many countries airlift to Germany on a regular basis, it would seem there is regional agreement with Germany simply because of how many ICU beds they have. I don’t know this for sure, but it seems quite reasonable that Holland has so few ICU beds “on purpose” because it has reached an “overflow” agreement with its neighbour. That would mean airlifts are a feature and not a bug. Why would you spend money on “fixed” ICU infrastructure when you could have a “variable” cost by simply reaching an agreement with the Germans
The following is a walk through a whole range of data points that relate to the airlifting story but also to the general COVID19 data points in Holland.
Total number of hospitals
[4] https://www.statista.com/statistics/949593/hospitals-in-the-netherlands/
Total no. of ICU beds
This article[5] from September quotes Diederik Gommers, is probably the best piece I can find on the issue of ICUs in Holland.
Currently there are about 600 people in ICU in the Dutch hospitals, including less than 50 with the coronavirus. In April, ICUs were treating around 1,400 people with coronavirus and 350 people with other health problems. According to Gommers, ICU stays being two thirds shorter may mean that the Netherlands' usual 1,200 ICU beds are sufficient for a second wave.
[5] https://nltimes.nl/2020/09/15/icu-capacity-covid-patients-three-times-higher-first-wave-association
So according to Gommers, who should know what he is talking about, the Dutch system dealt with, what I assume is a peak rate, of 1,750 ICU patients even though the “usual” capacity was 1,200. So there was enough stretch in the system to deal with such an uplift, and yes, they did airlift some (we don’t know how many) during the first wave to Germany.
It’s important to note that Holland dealt with those numbers in April 2020 when they were taking 22 days to treat a COVID patient. That is now down to 8 days only, which means that Holland has far more capacity to deal with a second wave that the first. Almost “triple” the COVID capacity.
So, something is rotten in the narrative.
It cannot be true that Holland in April was able to deal with 1,400 COVID patients (av. 22 ICU days) and now is struggling to deal with 500 (av. 8 ICU days). There cannot be “an overload of the system” unless Gommers is lying about the April numbers.
[4] https://www.statista.com/statistics/949593/hospitals-in-the-netherlands/
[5] https://nltimes.nl/2020/09/15/icu-capacity-covid-patients-three-times-higher-first-wave-association
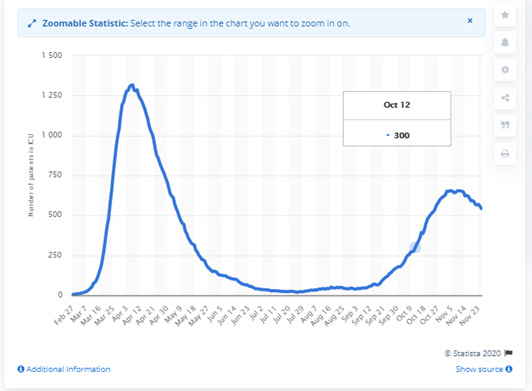
This is a good and up to date chart that shows the ICU issue today vs March/April 2020.
Number of patients in intensive care in the Netherlands due to the coronavirus (COVID-19) as of November 25, 2020
Based on the article from 20 May 2020[6]
There were 275 Covid-19 patients in intensive care on Wednesday, a decrease of 18 since Tuesday and the lowest total since March 18. In the 41 days since the peak of 1,417 intensive care cases was reached on April 9, the number of patients being treated in ICU has gone down 39 times.
[6] https://nltimes.nl/2020/05/20/covid-19-icu-patient-total-275-govt-plans-big-increase-icu-capacity
And
The Netherlands will instead invest in increasing permanent ICU capacity to 1,700 spaces, with the ability to temporarily add another 1,300 ICU beds if the demand arises. While the Cabinet investigates possible bottlenecks to reaching that target, the ministry ordered more ventilator machines to sufficiently equip a total of 3,000 intensive care unit spaces.
Clearly, they have not “increased capacity to 1,700”.
If you only have 500 people in ICU with COVID and that is 50% of occupied beds, why would you need to airlift to Germany if you had increased capacity to 1,700.
Some per capita ICU beds data
Holland
Total population 17.28m
Based on 1300: 1 bed per 13,292 people
Or 7.5 per 100,000
Germany
Population 83.02m
ICU beds 29,600/42,300
Based on 29,600: 1 bed per 2,804 people
Or 35.6 per 100,000
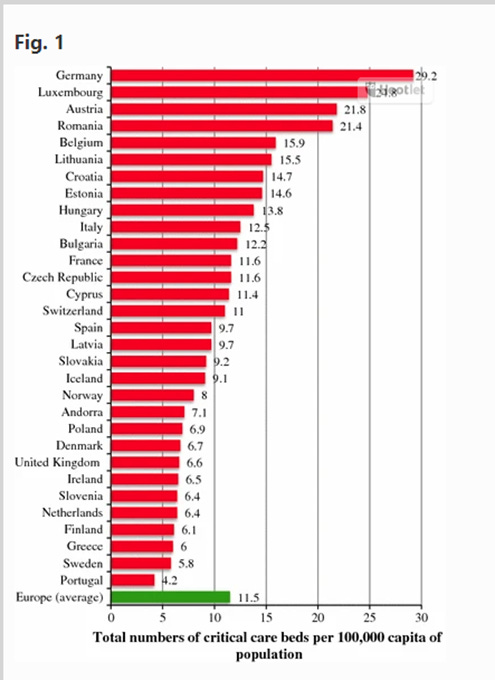
ICU per capita
This 2012[7] report concurs. The shape of it has not changed since then. Report name: The variability of critical care bed numbers in Europe
Holland has one of the lowest per capita ICUs in Europe, on par with the Greeks and miles behind places like Cyprus and Estonia, let alone the Germans. They simply do not spend enough money on ICUs. And significantly below the average also.
That’s the real story.
ICU per hospital
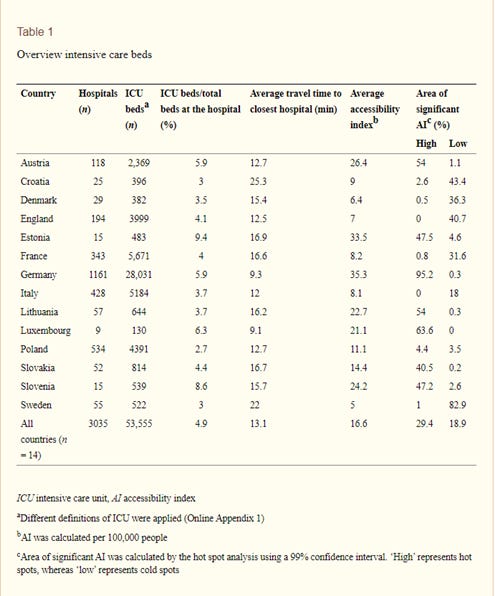
A more recent report from Sept 2020[8] looks at 14 European countries and their ICU capacity. Holland is not in the group, but we can see how it ranks through simple maths.
[8] https://www.ncbi.nlm.nih.gov/pmc/articles/PMC7472675/
Holland: 1,200/549 = 2.18 ICU beds per hospital (lower than anyone on the list)
Poland: 534/4,391 = 8.22
Croatia: 25/396 = 15.84
October Partial Lockdown
Holland went into partial lockdown on 14th Oct 2020[9]
[9] https://www.government.nl/latest/news/2020/10/13/partial-lockdown-needed-to-bring-down-infections
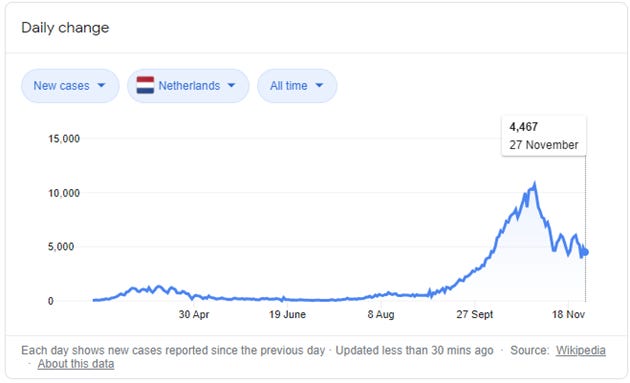
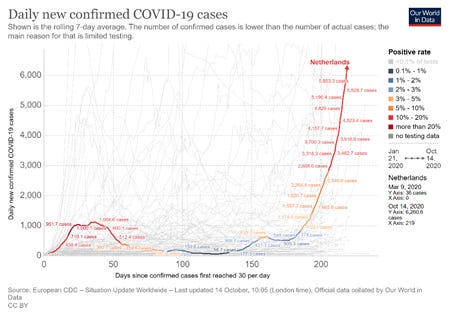
Cases from the beginning
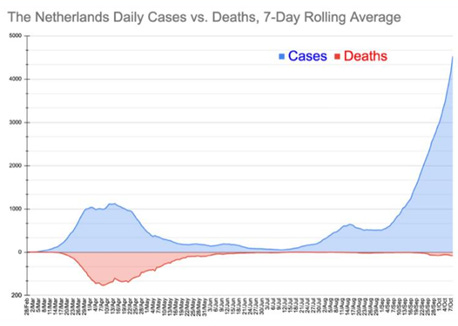
Clearly there are far more cases today than in April, it would seem the second wave is worse than the first.
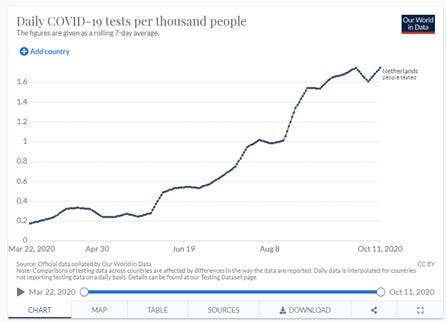
But, testing has exploded in Holland, like everywhere else.
In April, it was mostly/exclusively symptomatic that were tested. That reduces the universe of those being tested by about 90% (as approx. 90% have no symptoms).
What has happened since is that testing programs have exploded and they are testing asymptomatics too.
The medical definition of a “case” pre pandemic was a diagnosis based on test AND symptoms. Today it is based on test alone. “Case” has been redefined to the point of absurdity and corruption.
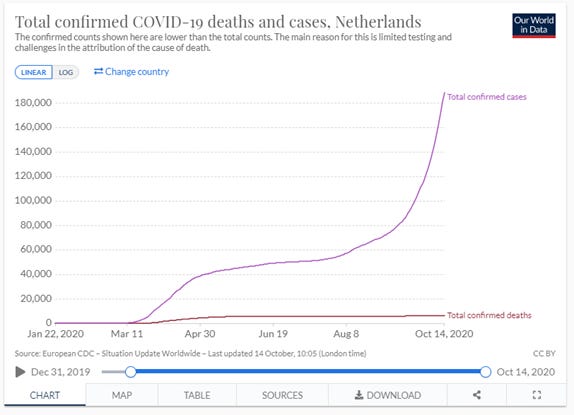
Deaths from the beginning
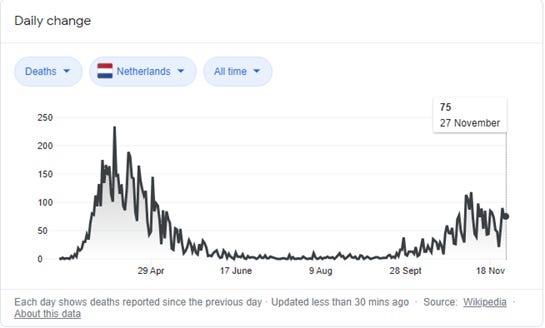
But when you look at the stat that matters, the bottom line, deaths are far fewer during the second wave.
What is clear from this chart is that a new virus entered the population in March/April and killed a group of very old and frail people.
That virus is now endemic and has now joined the 16 other endemic viruses that swirl around the world, 4 of which are also corona viruses.
It cannot be “eradicated” like smallpox because it can oscillate back and forth between humans and animals. It is here to stay, and it is “seasonal”, just like other corona viruses. The chart shows its seasonal nature.
This is a good chart from October that shows cases/deaths in context
But if you look at the Dutch gov site you will see this.
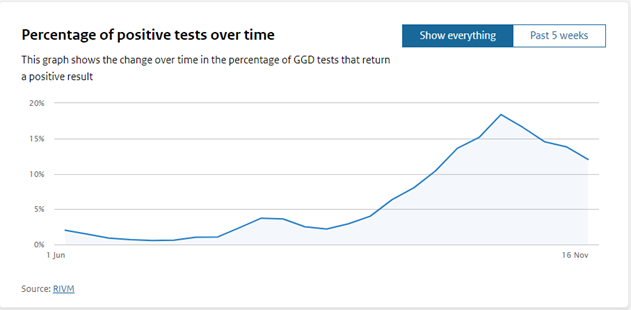
Percentage of positive tests over time[10]
[10] https://coronadashboard.government.nl/landelijk/positief-geteste-mensen
The Dutch are playing chart games.
This chart, from the government dashboard, showing % of positive tests only starts from June. It’s disingenuous and designed to create the illusion of a meaningful second wave. If they started from March, when they were testing symptomatics, you would see a much larger % of positive tests making this wave seem insignificant. That wouldn’t be narrative supporting.
But it gets better.
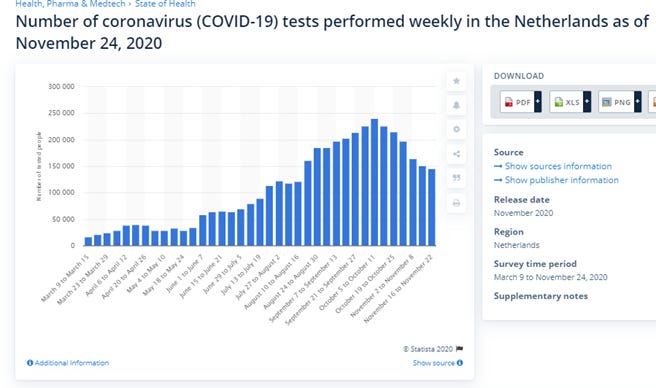
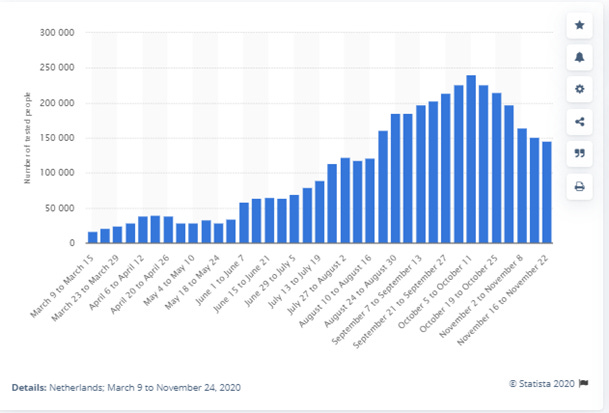
Statista shows that Holland conducted 29,098 tests in the week between 30-3 to 05-04.
In that same week it found 6,985 cases.
That is a percentage of positive tests of 24%, significantly above an average of below 15% during Oct/Nov
Testing and cases since mid Oct
The second national lockdown kicked in on 14Th Oct
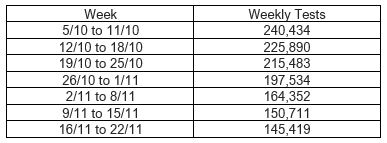
In the week before the lockdown testing peaked at 240,434 tests in that week
But what is most astounding is that the government started reducing weekly testing numbers straight after the lockdown started
In the week ending 11/10 the government did 240,434 tests
The new national lockdown is put in starting 14/10
In the week ending 22/11 (just 6 weeks later) they did 145,419
I reduction of testing of 39.5%!
Which correlates very nicely with a reduction in cases across the country.
See, lockdowns work! I sneaky slight of hand to control a national narrative.
The average percentage of tests that were positive during the lockdown/winter period was about 13%.
If they had done 240,000 tests in the 3rd week of Nov. instead of 145,000 they would have had 65% higher cases! Not very helpful to the lockdown narrative.
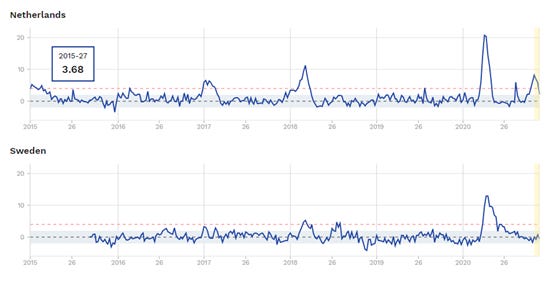
What is all cause excess mortality in Holland?
Since 2015 and compared against the control group of Sweden that has not used lockdowns. I use the word lockdown in the now conventional sense where a myriad of strict interventions are used on the population under the threat of fines and imprisonment.
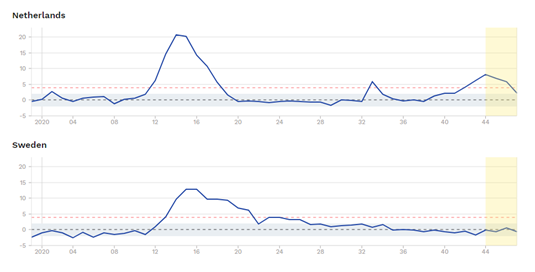
And since beginning of 2020
Some general points and observations:
Clearly all cause mortality is volatile and with seasonal tides
These excess mortality charts are adjusted for population size differences
The first wave was obviously outside the normal range, but the “second wave” is clearly within the normal range of seasonal, northern hemisphere mortality
It is clear to see that Holland with lockdowns has faired worse than Sweden without
It is also clear to see that Holland excess mortality is sharply down already back to the middle of the range of normal mortality…so why continued lockdowns?
Any headlines that you read about Sweden, need to be mapped over their excess mortality charts.
Cases rising but testing rising faster
Here was see the sharp rise of cases on a 7 day rolling av.
In April c. 1,000 cases per day
In October c. 5,800 cases per day
5.8x increase in cases
But…what are testing numbers?
22th March 0.178 Tests 1,000 people
11th Oct 1.748 Tests per 1,000 people
10x increase in testing
CFR – Case Fatality Rate
Here are some running totals
Annual death in Holland
153,000 per annum(419 per day)
Thoughts:
Clearly there was an initial wave of COVID related deaths in Holland, although we do not know how many died because of it rather than with it. But CDC numbers showed that in the US only 6% of there stated COVID deaths died without any other known co-morbidities. 94% died with an average of 2.6 comorbidities
Over 5 months to mid Oct there were 952 COVID deaths in a country that has 419 people die each day. Hardly a crisis that warranted a national loss of basic civil liberty that actually came in on the 14th Oct
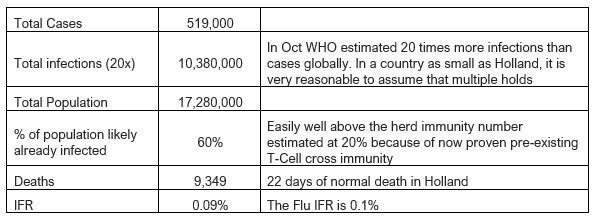
IFR: Infection Fatality Rate
As at 1st Dec
Thoughts:
Even if you were to assume a lower infection multiplier, let’s say only 10x you land on an IFR of 0.18%. The shape of COVID19 IFR is by now clearly established and it is that of the flu
The flu is more deadly in young kids and COVID is more deadly in very old and frail people
But averaged out across the whole of society, it has the same shape of lethality as the flu
Locking down free societies is unambiguously wrong in every sense of that word
For the government to continue locking Dutch people down is sinister and can not be supported by any of the available data
What are ages of deaths in Holland?
https://dc-covid.site.ined.fr/en/data/netherlands/
Higher COVID-19 mortality among men
Over half of confirmed or suspected COVID-19 deaths were male: 4,451 men against 3,836 women died of COVID-19 in March and April. In relative terms as well, per thousand inhabitants, there were more male than female COVID-19 deaths across the different age groups. Male COVID-19 mortality was even twice as high as female COVID-19 mortality in the age group 75 to 79 years (2.28 against 1.03 per thousand inhabitants).
The average age of men who died of confirmed COVID-19 was 79.6 years; the average age of the women was 83.4 years. The average age was slightly higher among deaths due to suspected COVID-19: 81.9 years among the men and 84.6 years among the women.
Life Expectancy
Male life expectancy at birth is 77.1 years.
Female life expectancy at birth is 82.4 years.
Some general thoughts on the flu
Here are some facts and figures for the 2018/2019 flu season in Holland
https://www.rivm.nl/sites/default/files/2019-09/TG_123539_011592_Griep_cijfers_A4_EN.pdf
Thoughts:
There are typically 400,000 actual cases each year. That means “with” symptoms
About 2,900 deaths
If the shape of flu in Holland is similar to everywhere else, then there will be hardly any flu deaths this year (probably will be down by 90-95%). Of the 9,000 COVID deaths, about 3,000 were either misdiagnosed flu or that COVID got them before the flu could. Either way, you cannot look at COVID19 death data without understanding the underlying flu data. They might be caused by different viruses, but they target essentially the same very old and frail constituency and they present in a very similar manner.




Hello Unbekoming,
Great analysis of the situation in the Netherlands at the time. I don't have every detail ready myself, but you have certainly shown the broad outline well. In my experience, there has been little going on since the first wave, except for constant panic-mongering. And this is also reflected in your analysis.
There was indeed a first wave. But gradually I started to doubt the statistics about this and the high peak that we see in the statistics. I deduce this from, among other things, manual corrections to the death figures by CBS.
Glad you found my articles. My focus is on interpreting the Dutch covid statistics. Because a lot of essential information is withheld by the authorities, I also focus on the surrounding countries (UK, Belgium, Germany). Hopefully it helps you to understand more about the situation here.
All the best,
Daniel